At TruckSpy, we're constantly innovating to bring you tools that enhance the safety and efficiency of your fleet. Our latest addition is a unique feature that visualizes your FMCSA performance metrics, transforming raw data into insightful graphs. And the best part? It's absolutely free! Check it out for yourself at TruckSpy Directory to see it in action.
Understanding the FMCSA
The Federal Motor Carrier Safety Administration (FMCSA) plays a crucial role in ensuring the safety and efficiency of commercial motor vehicles. They collect data on inspections, violations, and accidents to monitor fleet performance and compliance with safety regulations. This data is publicly accessible and provides a wealth of information for fleet managers.
The Importance of Monitoring Your Metrics
Staying up-to-date with your fleet's performance metrics is vital. It helps you identify any discrepancies or areas that need improvement. For example, you might discover errors in reported data or uncover issues you weren't aware of. Regularly checking these metrics ensures that your fleet operates at its best and remains compliant with industry standards.
Gleaning Insights from Your Data
Analyzing your fleet's data can reveal a lot about your operations. For instance, if your drivers consistently pass inspections but your vehicles often incur violations, it might indicate a strong driver training program but a potential issue with vehicle maintenance or equipment. Understanding these nuances helps you make informed decisions to enhance your fleet's performance.
The Do-It-All Fleet Management Platform.
Start Today, No Contract. No CC.
Understanding the Charts
Two charts I'd like to highlight:
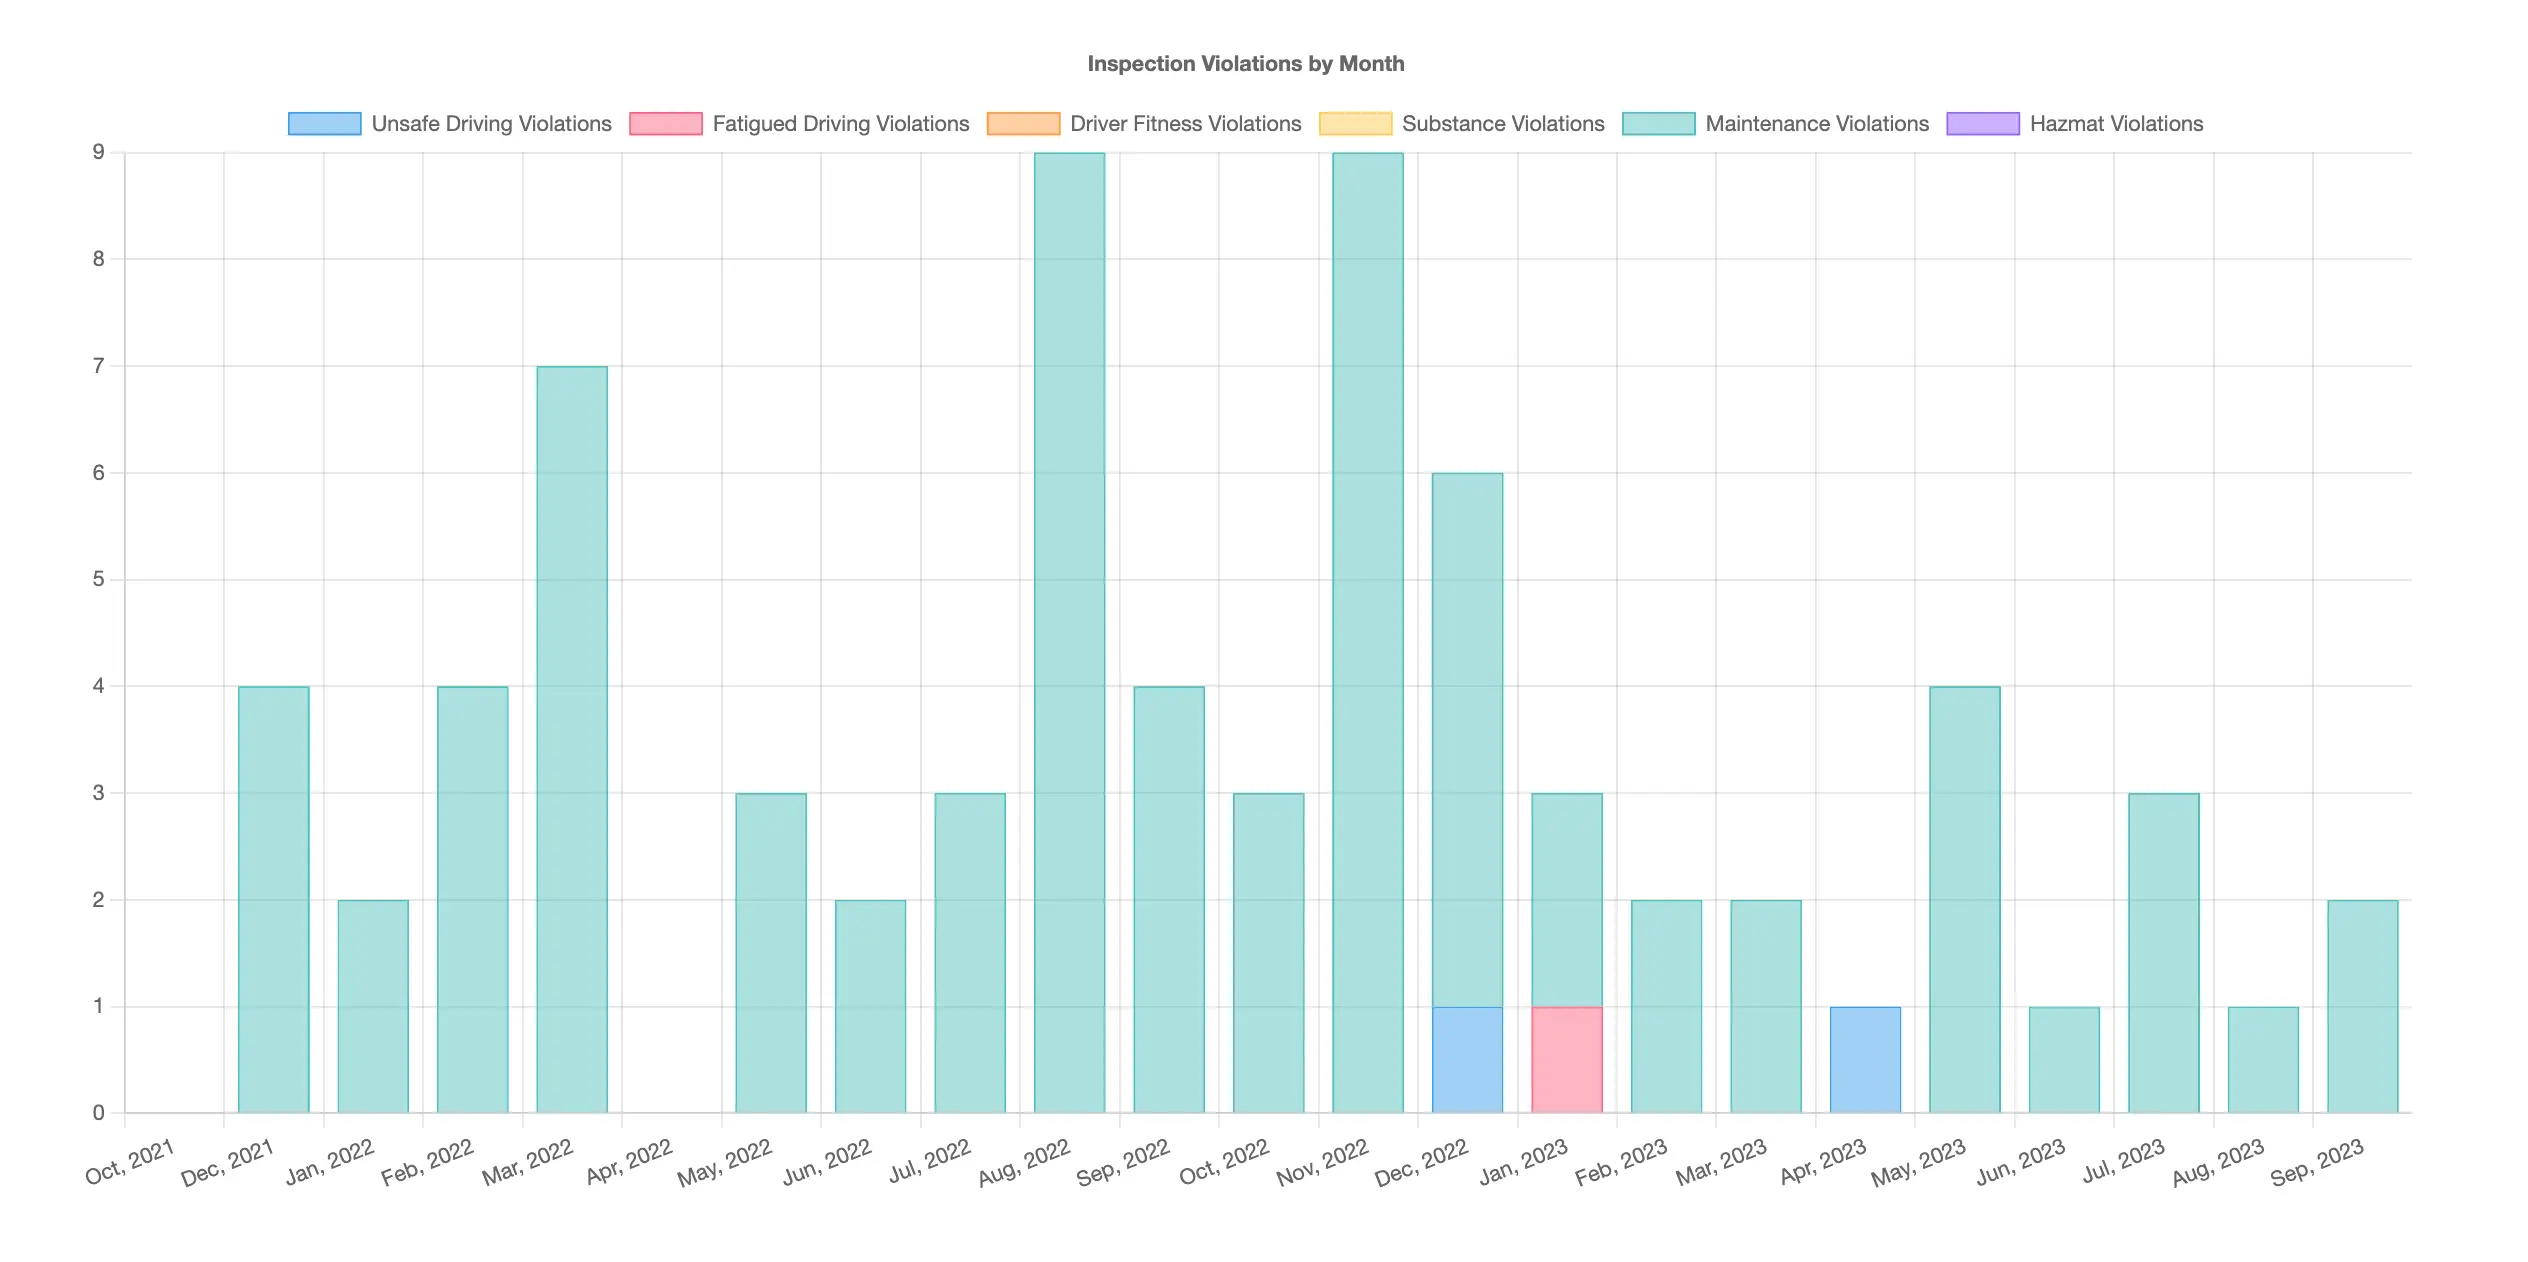
- Chart 1: A stacked bar graph showing the types and number of violations over time.
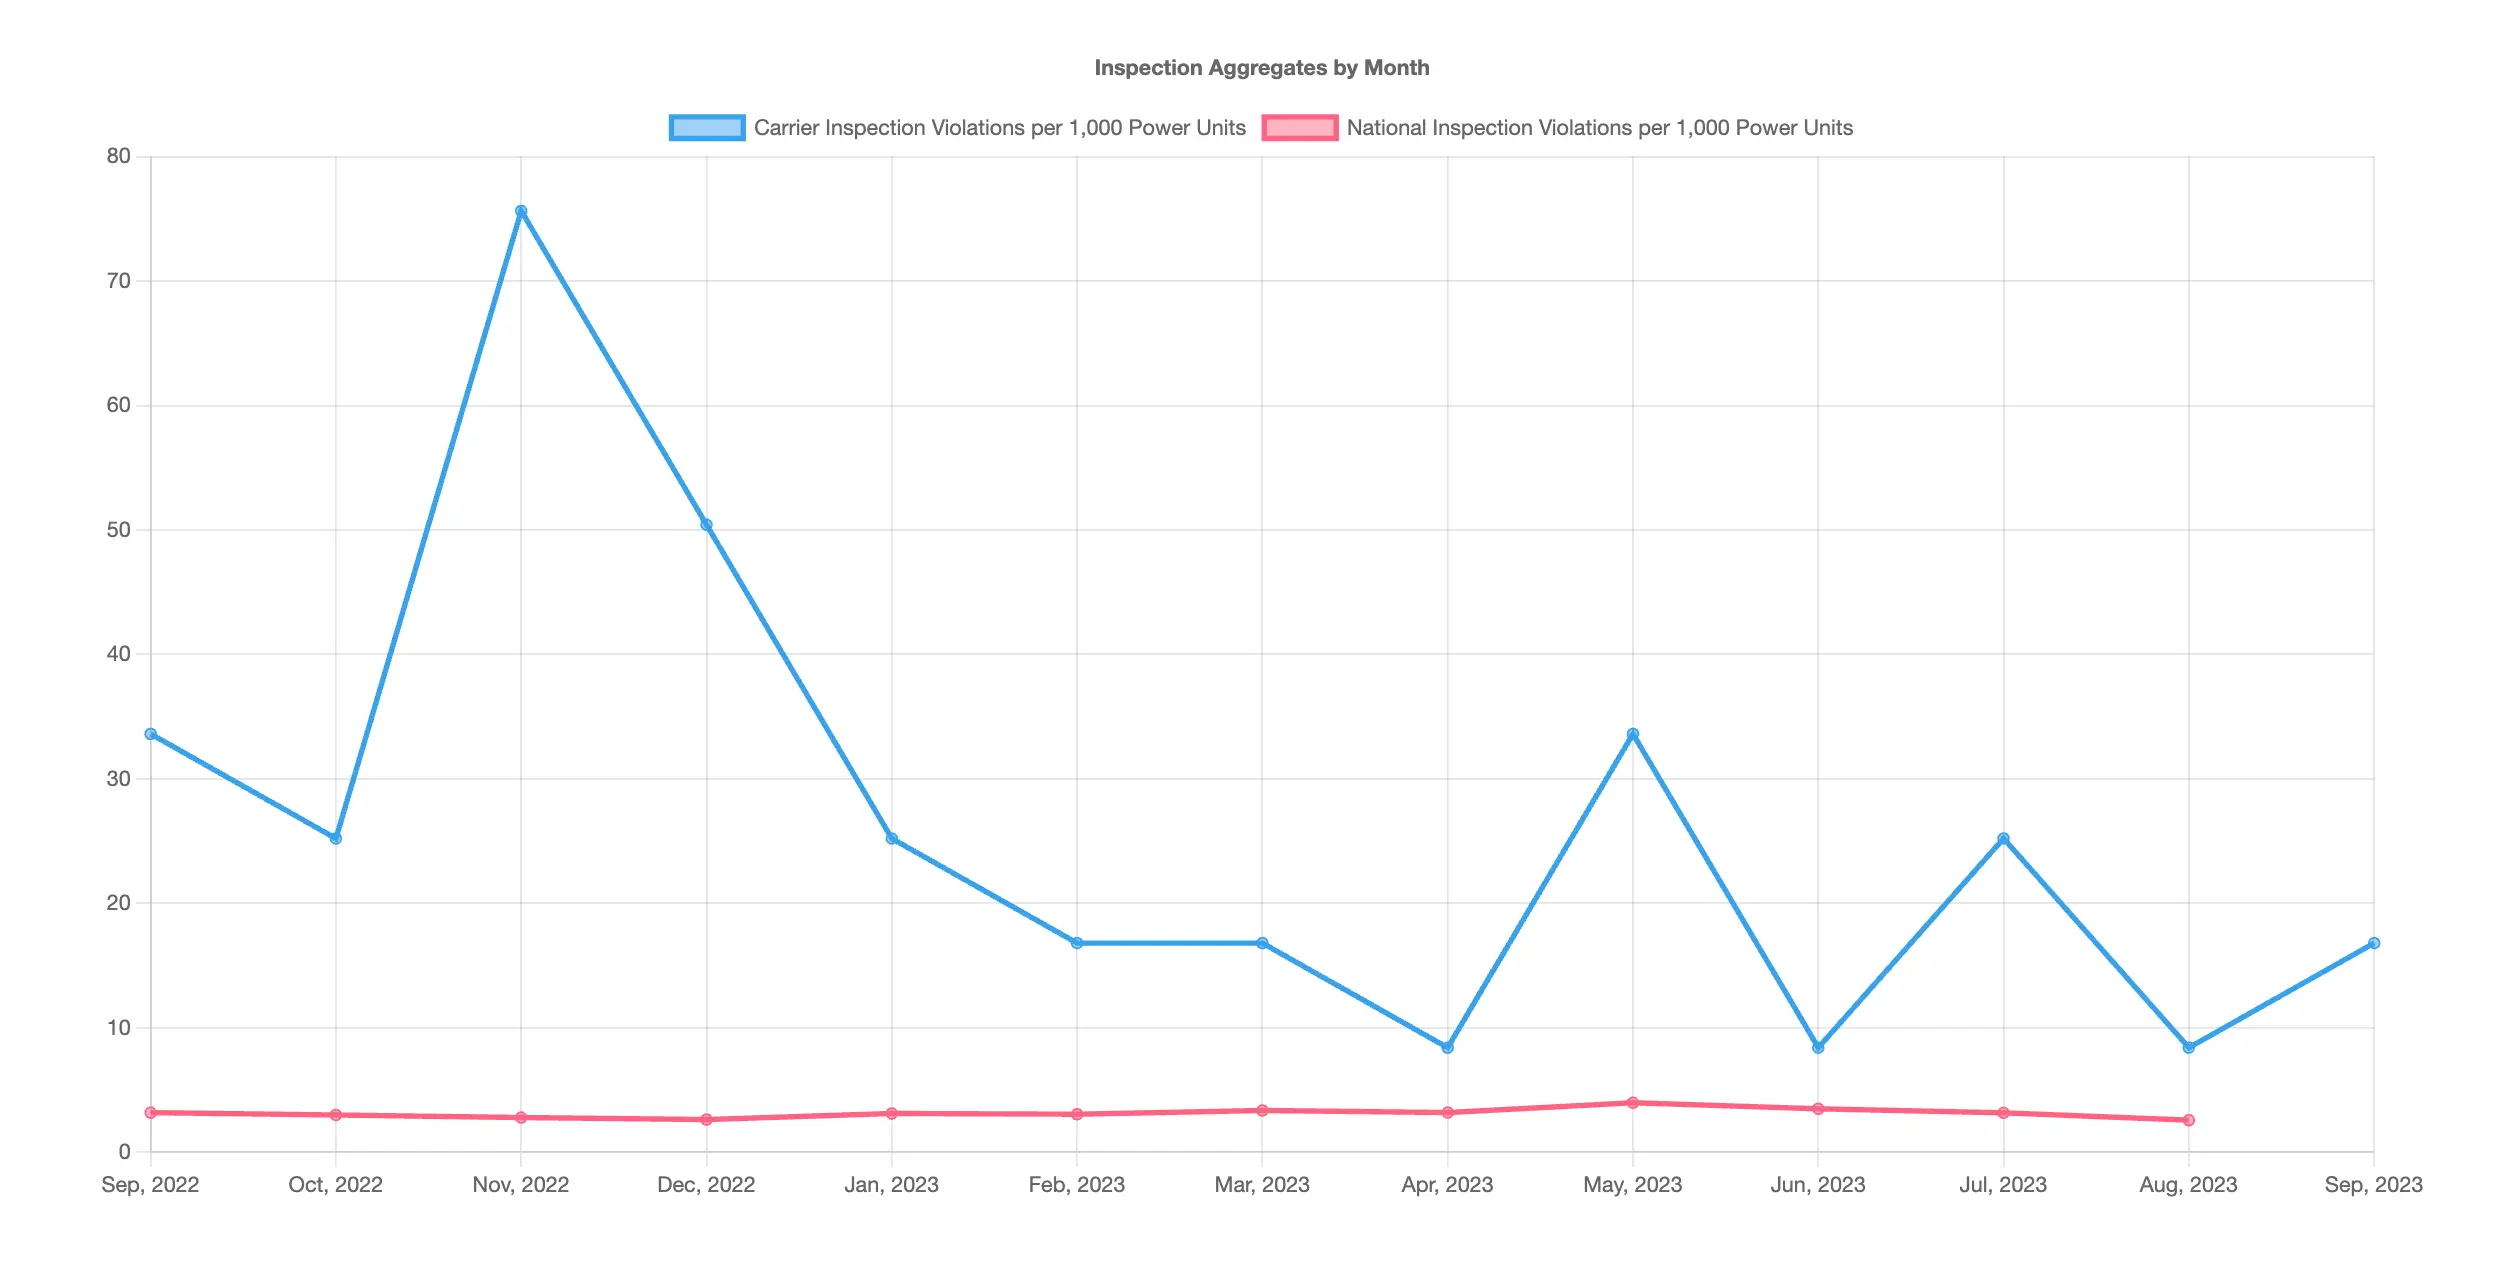
- Chart 2: A line chart comparing your fleet's violations relative to its size against the national average.
Conclusion
Understanding your fleet's performance metrics is crucial, but visualizing this data can take your insights to the next level. Our new feature at TruckSpy transforms raw FMCSA data into easy-to-read graphs, helping you quickly identify trends and make data-driven decisions. Find out more About Us by checking out our YouTube Channel or The Road Forward Podcast. Thanks!
Recent Blogs

by Elyse Byers
July 5, 2024